Examining homeownership rates across racial groups
By Emily Mack |
The homeownership rate in the U.S. grew in the decade between 2012 and 2022. However, that positive note can be misleading. A recent report from the National Association of REALTORS® (NAR), Snapshot of Race and Home Buying in America, details the persistent gaps in homeownership rates among racial groups, particularly for Black buyers.
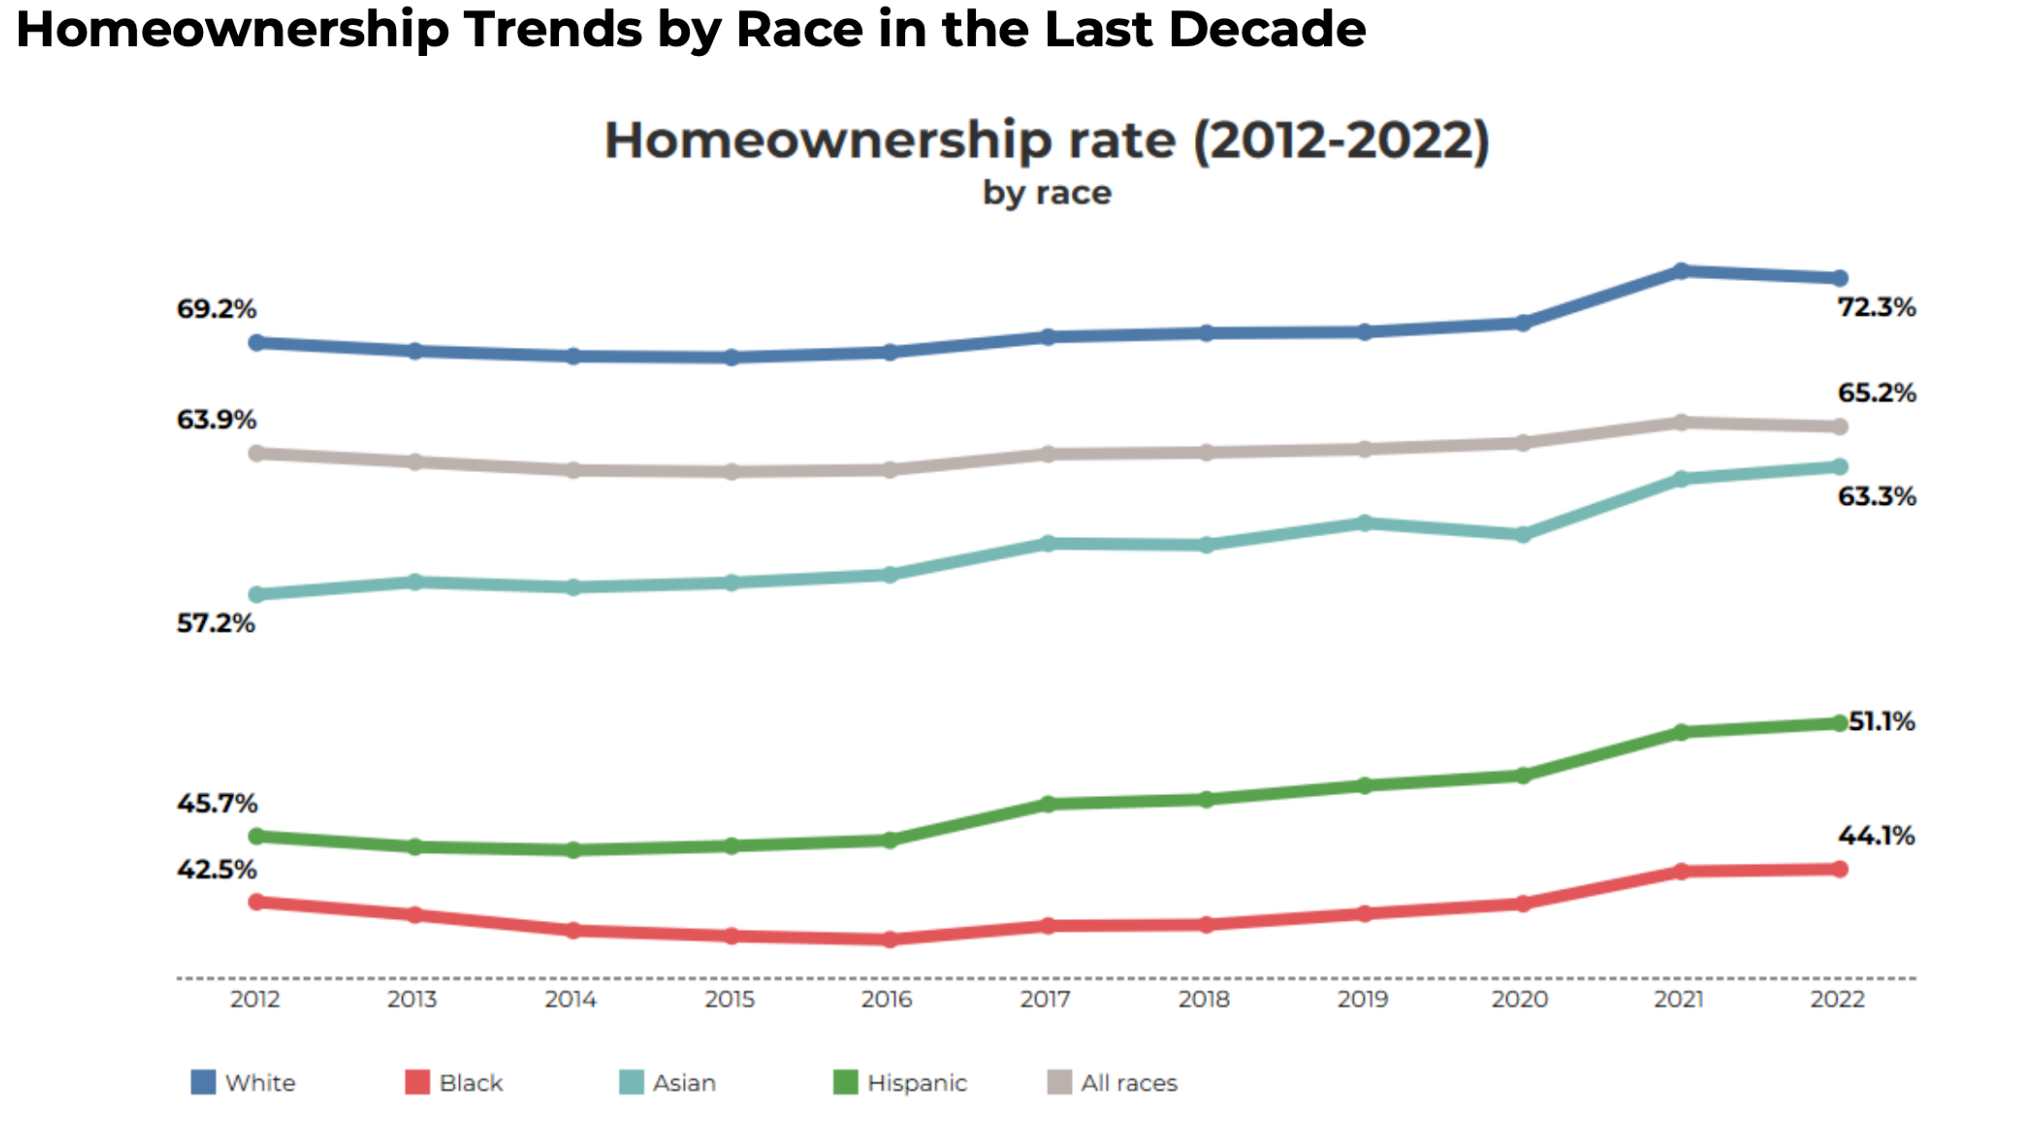
Drawing on information from the American Community Survey’s Public Use Microdata Sample (PUMS), the report provides a more focused look at how homeownership has increased across the country’s largest racial groups — white, Black, Asian and Hispanic — from 2012 to 2022, the last year from which data is fully available.
For all races combined, the homeownership rate increased steadily during that period, save for a small dip in 2022, presumably due to increased mortgage rates post-pandemic. In 2012, the national homeownership rate was 63.9%. That figure rose every year through 2021, when it reached 65.4%, a record high, before falling slightly to 65.2% in 2022.
The pattern was similar for white homeowners, although they generally maintain a rate above the national average, ending 2022 with a rate of 72.3%. Interestingly, though, all three minority groups in question resisted the 2022 dip. Homeownership rates increased during that year for Asian and Hispanic homeowners and remained the same for Black homeowners.

Asian homeownership rates
Based on the latest PUMS data, Asian Americans saw the most pronounced increase in homeownership, increasing 6.1% since 2012. That means, in the last decade, nearly 1.5 million more Asian Americans have become homeowners. That’s nearly twice the growth of white homeownership, which increased 3.1%.
In Illinois, 66% of Asian Americans are now homeowners — 3% higher than the national average.
That rise is expected to continue, too, particularly in Montana and New Mexico where more than 20% of the Asian population is on the cusp of reaching the median buying age (43 years in Montana and 40 years in New Mexico).
Hispanic homeownership rates
Meanwhile, Hispanic homeownership rose similarly to Asian homeownership, increasing 5.4% since 2012. That’s an additional 3.2 million Hispanic Americans who are now homeowners.
In Illinois, 59% of Hispanic Americans are now homeowners — 7.9% higher than the national average.
Hispanic homeownership rates are expected to grow the most in New Hampshire and Alabama, where 24.1% and 16.7% are reaching the median homebuying age, respectively. Those are the highest percentages among all U.S. states.
Black homeownership rates
However, homeownership growth was not quite as strong among the Black population. As 950,000 more Black Americans transitioned into homeownership since 2012, that reflects an increase of just 1.6%: the only growth rate lower than that of white homeowners.
At 40%, Illinois’ rate of Black homeownership is even lower than the national rate of 44.1%
NAR did note the overall positive growth rate as “encouraging,” highlighting that the disparity between white and Black homeownership dipped somewhat in 2022. Still, it remains 2.4% higher than in 2012.
Affordability challenges facing minorities
As sizable portions of minority groups age into the median homebuying age — 35 for first timers — it’s natural that minority homeownership would increase. However, many of those potential buyers will be hampered by race-specific affordability challenges.
On average, non-white households have lower incomes compared to white households, particularly Black households. And for Black households, that gap is widening. In 2022, the median Black household income was roughly $47,800. That’s $27,900 less than their white counterparts. However, in 2012, the income gap between the two groups was markedly at $21,540.
Although the gap isn’t widening for all groups — in 2022, the gap between Hispanic and white households shrunk to $13,000 — a lower income, naturally, makes it difficult to save for increasingly high down payments. Most buyers of all backgrounds need to borrow money in the form of a mortgage, but access to credit varies state to state — and race to race.
For example, in 2022, Mississippi had the highest loan denial rate in the country at 21%. But that number spikes even higher for Black and Hispanic applicants: to 34% and 25%, respectively, the highest disparities (compared to white applicants) in the nation.
In Illinois, 25% of Black applicants were denied, followed by Hispanic applicants at 20%. Meanwhile, both Asian and white applicants were denied 14% of the time.
Nationwide, too, the pattern stands. According to data from the Home Mortgage Disclosure Act, mortgage applications were denied at a rate of 26% for Black applicants and 22% for Hispanic applicants: a stark contrast from the denial rates of 16% and 15% for white and Aisan applicants, respectively.
Of course, even once a loan is attained, affordability challenges don’t disappear. In certain states, minority homeowners spend a much higher chunk of their monthly income on housing than white homeowners. For instance, in one of the country’s most populous markets, New York, roughly 37% of Hispanic and Asian homeowners spend more than 30% of their income on housing, compared to 25% of white homeowners. The figure is even higher for Black homeowners at 39%.
Illinois, too, presents a similar picture. While 21% of white homeowners spend more than 30% of their income on housing, the same is true for more than 34% of Black homeowners, 27% of Asian homeowners and nearly 38% of Hispanic homeowners.
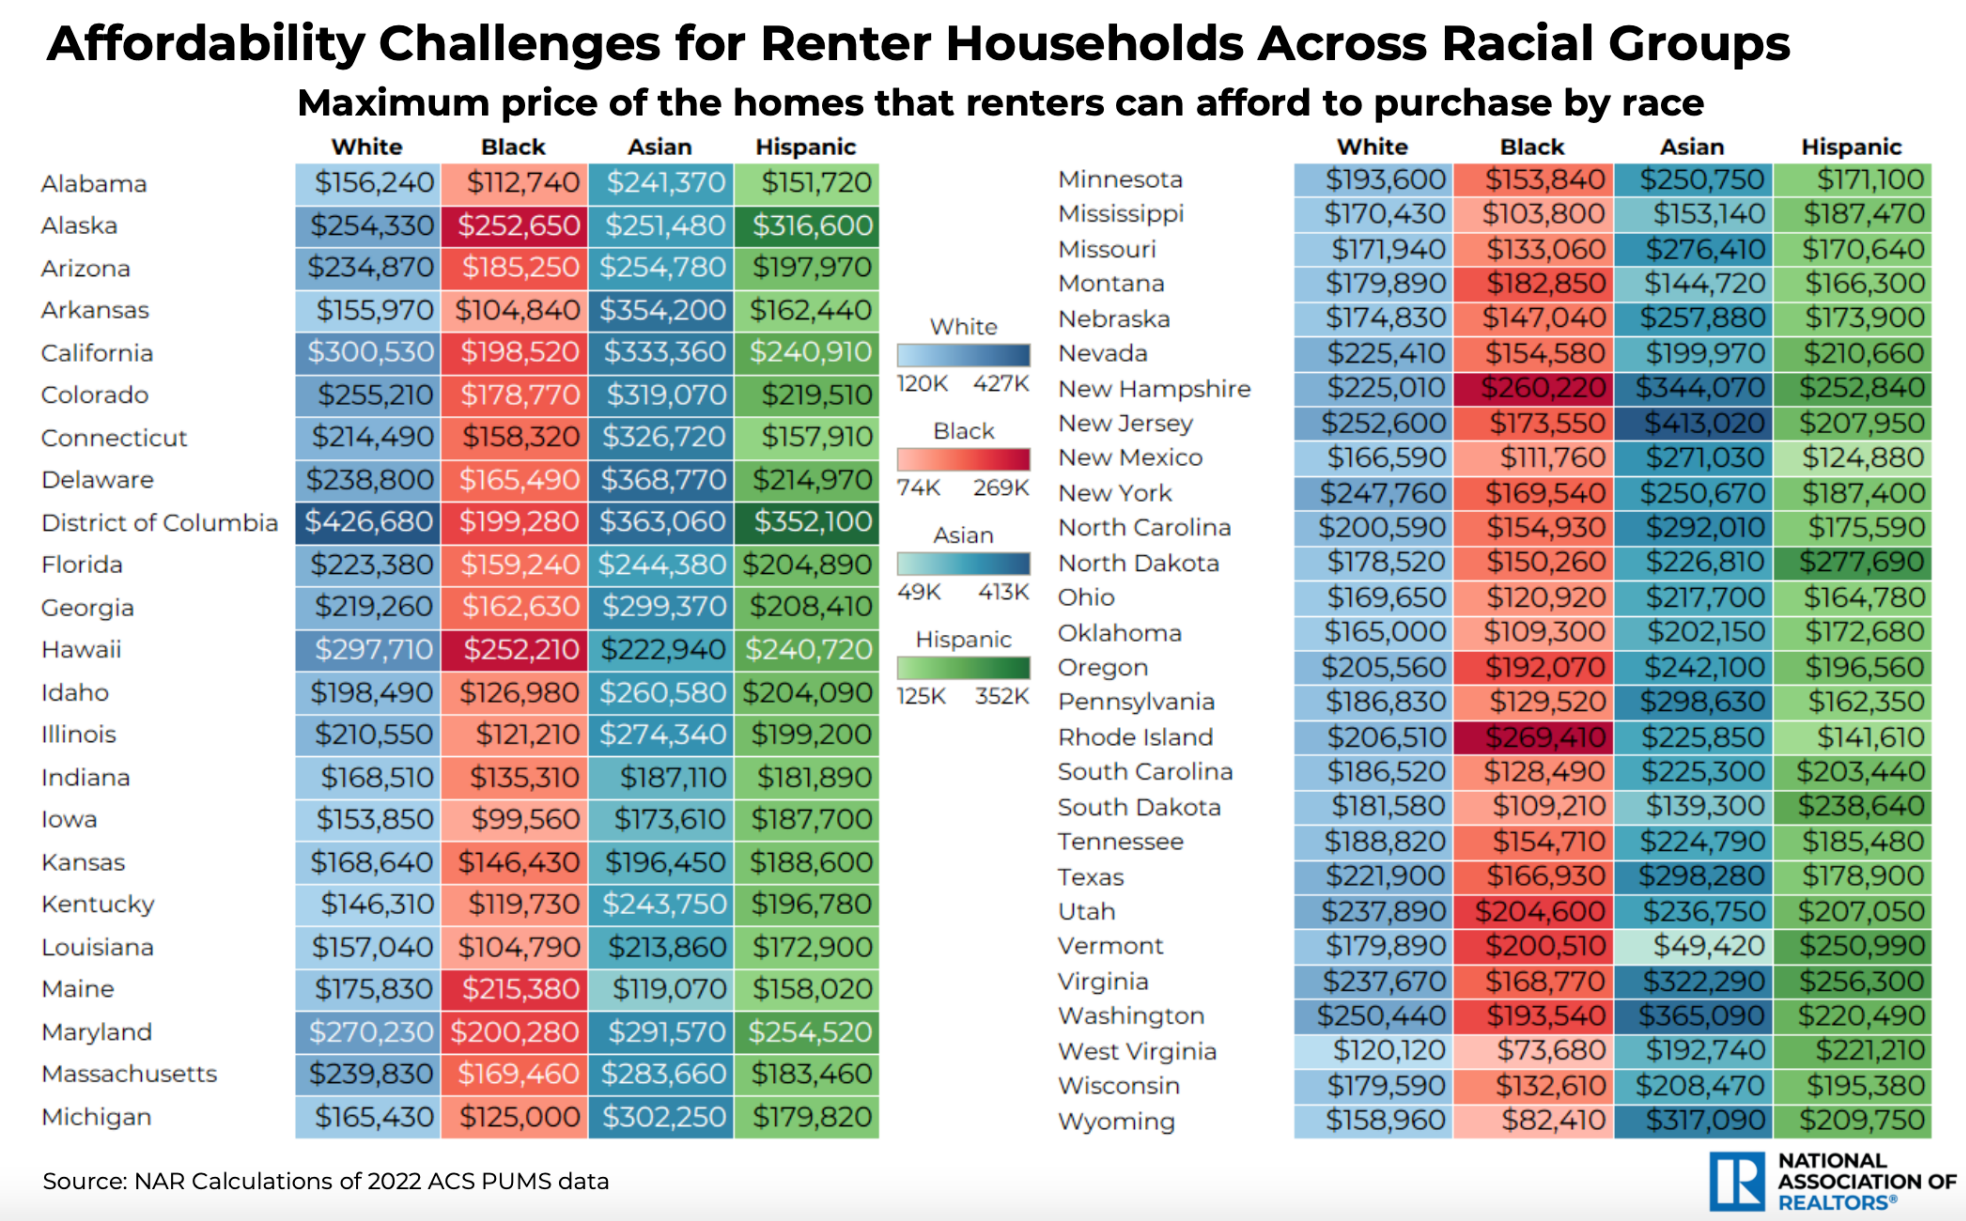
Due to various affordability and credit challenges, in 2022, the most expensive home that Illinois renters could afford to purchase varied greatly across races. Assuming 30% of a homeowner’s income is on mortgage payments (with a 30-year fixed mortgage at a 6.6% rate, plus a 10% down payment), NAR determined the hypothetical prices. It was lowest for Black renters, at $121,210, followed by the maximum price Hispanic renters could afford, $199,200. For white renters, the maximum price was $210,550. It was highest for Asian renters at $274,340.
In fact, Asian renters maintain the highest affordability across 40 states.

Discrimination during the homebuying process
Once a loan is obtained though, the process is not so simple for minority buyers. Drawing on information obtained for NAR’s 2023 Profile of Home Buyers and Sellers, the association’s recent snapshot also provided some analysis on potential discrimination during the homebuying process.
According to NAR’s surveys, recent minority homebuyers were much less likely to end up in a predominantly white neighborhood than their white counterparts. Thirty percent of Hispanic homebuyers said their new neighborhood was mostly the same race as them, as well as 21% of Black homebuyers and 17% of Asian homebuyers. That’s compared to 67% of white homebuyers.
And the results may have to do with steering. Seven percent of Black homebuyers reported experiencing discrimination during the homebuying process, along with 3% of Asian and Hispanic homebuyers. Of those that did experience discrimination, agents steering clients to or from certain neighborhoods was the most common form reported across races, followed by discrimination during home appraisals.
The practice of steering has been illegal since 1968.
